
Think of Key Performance Indicators (KPIs) not as a high-school report card, but as the flight dashboard for your engineering team. These are the critical instruments showing your speed, altitude, and direction, making sure you reach your destination—your business goals—safely and efficiently. At their heart, these are simply quantifiable metrics that track how well your […]

Think of Key Performance Indicators (KPIs) not as a high-school report card, but as the flight dashboard for your engineering team. These are the critical instruments showing your speed, altitude, and direction, making sure you reach your destination—your business goals—safely and efficiently.
At their heart, these are simply quantifiable metrics that track how well your software delivery process is running. They measure efficiency, quality, and the real-world impact of all that hard work.
In today's engineering world, you have to move from guesswork to a data-driven strategy to stay competitive. Without the right metrics, teams are essentially flying blind. Are we building the right thing? Is our hard work actually creating value? Are we improving stability? A well-chosen KPI brings immediate clarity to these questions.
These metrics create a powerful feedback loop, giving you objective insights into your team's processes. They help you spot turbulence—like a bottleneck in the code review pipeline or a spike in testing failures—long before it turns into a five-alarm fire. Just as importantly, they give you a reason to celebrate real achievements and define what high performance actually looks like in your organization.
The goal isn't just to track everything. It’s to measure the right things consistently, and in a way that drives the outcomes your organization actually cares about. Good KPIs spark conversations, not finger-pointing.
Ultimately, the whole point of tracking KPIs is to connect your technical efforts directly to the company's strategic goals. When you start measuring what matters, you can finally answer the big questions that fuel continuous improvement.
Each of these metrics plays a specific part, and together, they paint a complete picture of performance. For a deeper dive into the fundamentals, this guide on KPI for Engineering Teams is an excellent resource.
A solid KPI framework is foundational, especially when you start defining the various https://hiredevelopers.com/roles-in-agile-software-development/. This shared understanding of success transforms how teams collaborate and deliver, paving the way for building better software, faster. By putting a thoughtful KPI strategy in place, you empower everyone—from individual developers to executive leadership—to make smarter decisions backed by real data.
To get a real handle on your team's performance, you can't just look at one thing. If you only focus on speed, quality will inevitably take a nosedive. But if you obsess over quality, you might never ship anything. The secret is balance, and that's where the four pillars of engineering metrics come in. Think of them as the foundation for a strong, stable structure—each one is critical, and together, they give you the complete picture.
Framing your KPIs this way helps you avoid common traps, like chasing vanity metrics that look good on paper but don't mean much in reality. It forces a more holistic view where delivery, quality, efficiency, and business outcomes are all seen as interconnected parts of a single system. This is how you build a sustainable, high-performance engineering culture where teams are getting better across the board.
This infographic breaks down how different software development KPIs—covering efficiency, quality, and impact—come together to form a balanced measurement system.
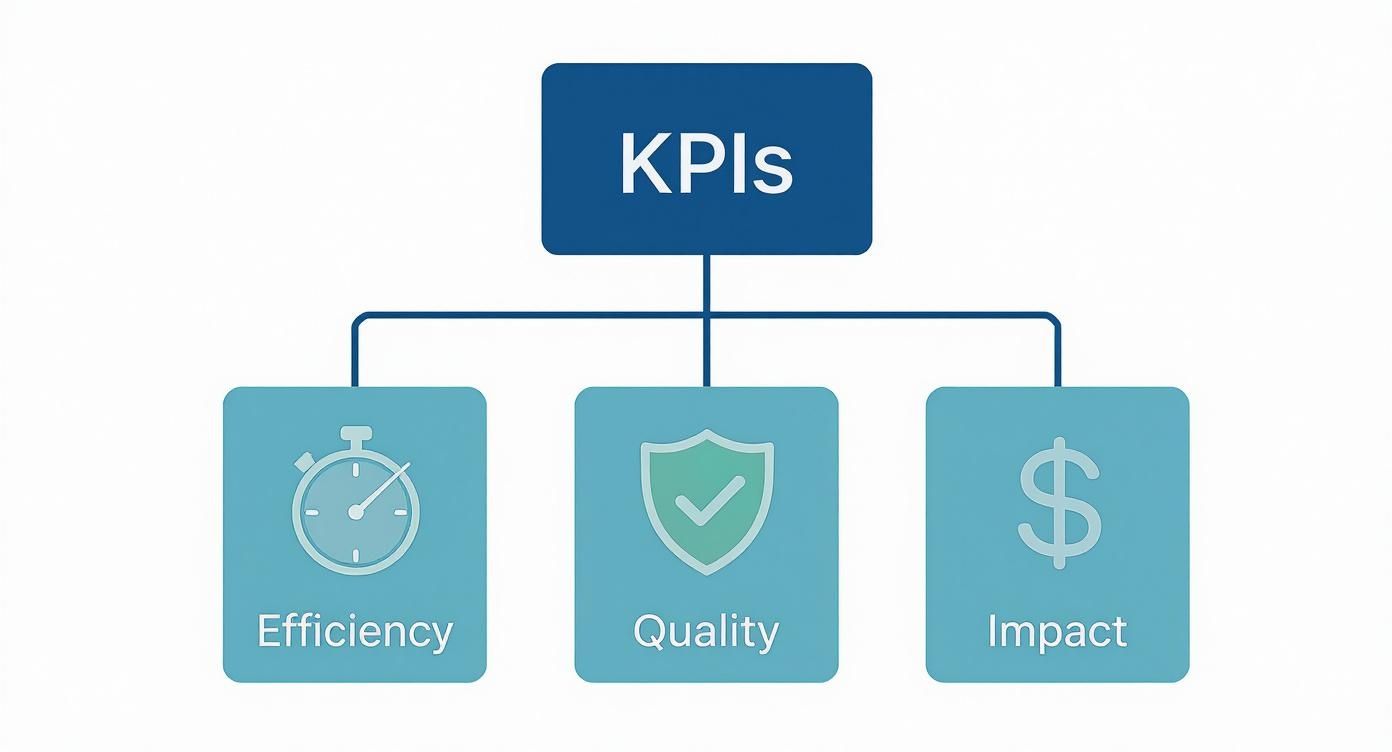
The visual makes it clear: a solid KPI strategy is built on multiple pillars, not just a single, isolated metric.
This first pillar gets right to the point, asking the most fundamental question: "How fast are we shipping value to users?" It’s all about the speed and predictability of your software delivery pipeline. These metrics help you see your team's throughput and, more importantly, expose the bottlenecks that are slowing everyone down.
Key metrics in this category often include:
One of the most respected frameworks for this is DORA (DevOps Research and Assessment). Their research is clear: high-performing teams deploy on-demand (often multiple times a day), while low performers might deploy less than once a month. Elite teams have a lead time of less than an hour, a world away from the weeks or months it takes less efficient teams. You can dive deeper into these crucial metrics in this comprehensive overview of software development KPIs.
Going fast doesn't mean much if the software you're shipping is full of bugs. This second pillar is all about answering the question: "How reliable and stable is our code?" Quality metrics are your safety net, making sure that your push for speed doesn't destroy user trust and system stability.
Measuring quality isn't just about counting bugs; it's about building a culture of prevention. These KPIs reflect the entire team's commitment to creating a dependable product, from initial code to production monitoring.
Essential quality and stability KPIs include:
This pillar goes beyond just speed to ask a more nuanced question: "How effectively is our team working?" It's all about finding and getting rid of the friction in your development process. These metrics help you see if your workflows are smooth or if there are hidden roadblocks wasting your team's time and energy.
By keeping an eye on efficiency, you can spot problems like code sitting around for days waiting on a review or getting stuck in long QA cycles. Fixing these issues doesn't just speed up delivery—it also cuts down on developer frustration, which leads to a much healthier and more engaged team.
This final pillar is arguably the most important. It answers the ultimate question: "Is our work delivering real value to the business and its customers?" This is where your engineering efforts connect directly to the company's bottom line. It's not enough to ship features quickly; you have to know if anyone is actually using them and if they're solving the intended problem.
Tracking business impact makes sure your team is building the right things. Metrics here might include:
This final pillar closes the loop, confirming that all the technical work your team is doing translates into real, measurable business success.
If you're looking for a single metric that tells the real story of your team's efficiency, forget about lines of code. The one you need to focus on is Cycle Time. It's the most powerful KPI for understanding how quickly your team turns an idea into a finished product for your customers.
Think of it like a stopwatch for your entire development process. It starts the second a developer makes their first code commit and stops only when that code is live in production. It’s a brutally honest measure of your team’s delivery speed because it captures everything—the coding, the reviews, the testing, and the deployment. It doesn’t measure how busy people are; it measures how fast value gets delivered.
When your Cycle Time is consistently low, you know your development process is humming along nicely. But when it starts to creep up or becomes unpredictable, that’s your first sign that friction is building up somewhere in the system.
Getting a handle on Cycle Time is pretty straightforward. You just need to track two specific moments for every piece of work, whether it’s a small bug fix or a major feature:
The calculation is as simple as it gets: Cycle Time = Deployment Timestamp – First Commit Timestamp.
To do this right, you’ll need to connect the dots between your version control system (like Git) and your deployment tools. The good news is that most modern engineering analytics platforms do this for you automatically. They can pull data from tools like GitHub, Jira, and Jenkins to give you a clear, real-time view of your Cycle Time trends.
The gap between elite teams and average ones is massive. Industry data consistently shows that high-performing teams often have a median cycle time of less than a day. For low-performers, that same process can drag on for weeks.
A 2022 survey highlighted a compelling reason to pay attention: organizations that actively tracked their cycle time saw a 30% improvement in delivery speed within a single year. Better still, teams that used this data to fine-tune their workflows achieved a 25% reduction in lead time and a 20% increase in deployment frequency. You can dig deeper into these software development KPI findings to see the full impact.
A short and predictable Cycle Time is the hallmark of an elite engineering team. It signifies a mature, automated, and collaborative process where work flows smoothly from concept to customer without getting stuck.
Here's where measuring Cycle Time really pays off: it helps you find exactly where things are getting stuck. By breaking down the total time into its individual stages, you can stop guessing what the problem is and start fixing it.
Here are the common phases you'll want to track:
By analyzing the time spent in each of these stages, you get a roadmap for improvement. For any team serious about agile development and continuous improvement, driving down Cycle Time isn't just a goal—it's the most direct way to deliver value faster and build a more responsive, high-performing culture.
Shipping new features at breakneck speed means nothing if the software is riddled with bugs and constantly crashing. While delivery metrics tell you how fast you're going, quality and stability KPIs tell you if the car is even safe to drive. This is all about measuring your code's reliability and protecting the user experience. You have to make sure your need for speed doesn't erode customer trust.
Think of it like this: delivery metrics are your gas pedal, but quality metrics are your brakes and steering. You absolutely need both to get where you're going without a disaster. These KPIs give you a crucial feedback loop, showing you exactly how your development habits are affecting the health of the final product.
And this isn't just about counting bugs after they’ve already frustrated a user. It's about building a proactive culture where quality is everyone's job. By tracking the right signals, you can spot troublesome patterns, fix the root causes, and stop defects long before they ever see the light of day.
One of the most straightforward ways to gauge software quality is the Bug Rate. This metric simply tracks the number of defects found after a release, giving you a clear pulse on your code's health. A high bug rate can be a symptom of a few different problems—maybe your testing process has holes, your code reviews aren't thorough enough, or even that the initial requirements weren't clear.
You can calculate this in a few different, practical ways:
Keeping a close eye on these numbers is non-negotiable for anyone in a senior quality role. The data is the ammunition you need to make a case for better testing resources or process changes. In fact, a deep understanding of a Product QA Manager role shows just how central this data is to steering the entire quality strategy.
When a bug inevitably slips through, how fast you can fix it is everything. Mean Time to Resolution (MTTR), sometimes called Mean Time to Recovery, measures the average time it takes to fix a problem from the moment it’s spotted. For any team that cares about user trust, this KPI is a direct measure of your ability to handle a crisis.
A low MTTR is a sign of a resilient team that can perform under pressure. It's a reflection of your entire incident response pipeline, from the first alert to the final, deployed fix.
A fast MTTR can turn a potential catastrophe into a minor hiccup for your users. It proves that even when things break, your team is ready and capable, which ultimately builds more confidence in your product.
Getting your MTTR down usually means beefing up your monitoring systems, having crystal-clear on-call playbooks, and running fire drills to practice your incident response. The goal is to make recovery a well-oiled machine.
While measuring failures is useful, the truly great teams are obsessed with preventing them in the first place. That’s where leading indicators come in—metrics that predict future quality. Instead of just counting problems, you start measuring the health of the processes designed to stop them.
A fantastic leading indicator is Code Coverage. This metric shows you what percentage of your codebase is actually checked by your automated tests. While hitting 100% isn't always practical or necessary, a healthy and growing code coverage percentage shows a real commitment to automated testing, which is one of the single best ways to catch bugs early.
Industry benchmarks really highlight the difference between the best and the rest. Elite teams often keep their bug rate below 0.5 bugs per KLOC and can crush critical bugs in under 24 hours. On the other end, lower-performing teams might see rates above 5 bugs per KLOC and take weeks to resolve major issues. It's no surprise that recent surveys show over 30% of dev teams now have dedicated QA departments to get a handle on this. You can see how you stack up by exploring more of these software development statistics.
Knowing which Key Performance Indicators (KPIs) to track is a great start, but it's only half the journey. The real magic happens when you turn all that data into clear, actionable insights your team can actually use. Setting up a KPI strategy isn't about creating complex, intimidating charts; it’s about making performance visible and building a culture around getting better every single day.
Think of it like the dashboard in your car. You don’t need a hundred different dials and gauges. You just need the critical few—a speedometer, a fuel gauge, and maybe a temperature warning—to tell you what you need to know at a glance. Your KPI dashboard should do the exact same thing for your development team.

The whole process has to start with your goals, not with the metrics. When you tie your KPIs directly to your bigger business objectives, you guarantee you're measuring what truly drives success.
The most common mistake I see teams make is picking metrics before they even know what they’re trying to accomplish. It's a classic case of putting the cart before the horse. Don't start by asking, "What cool things can we measure?" Instead, ask, "What is our single most important goal right now?"
Is your top priority to ship new features faster? Then Cycle Time and Deployment Frequency should be front and center. Or maybe you're dealing with stability issues and frustrated users? In that case, Change Failure Rate and MTTR become your most critical signals.
Here’s a simple, four-step process to get you on the right track:
For any organization planning to scale its team, getting a handle on your current performance with KPIs is non-negotiable. This baseline data is incredibly valuable when you're considering https://hiredevelopers.com/outsourcing-custom-software-development/, as it lets you set clear expectations and accurately measure the impact of new talent.
The main job of your dashboard is to make data easy to digest for everyone—from the newest developer to the head of product. It should spark curiosity and constructive questions, not fear or confusion. The best dashboards are simple, highly visual, and focused on team trends, never individual performance.
A great KPI dashboard tells a story. At a glance, anyone should be able to understand if the team is improving, where the challenges are, and what questions need to be asked next.
This table provides a simple framework for how you might structure a dashboard to serve different audiences, ensuring everyone is looking at the metrics that matter most to them.
| Audience | Primary KPI | Supporting Metrics | Goal |
|---|---|---|---|
| Engineering Team | Cycle Time | PR Review Time, Time in QA | Shorten the feedback loop and remove bottlenecks. |
| Product Leadership | Deployment Frequency | Lead Time for Changes | Increase the speed of value delivery to customers. |
| Executive Stakeholders | Change Failure Rate | MTTR, Bug Rate | Ensure product stability and protect user trust. |
This kind of structure keeps the focus squarely on team-level outcomes, which helps prevent the data from ever being weaponized to blame individuals.
Ultimately, the goal of implementing any kpi for software development is to kickstart productive conversations. Data should be the beginning of a discussion, never the end. Use your dashboard as a tool during sprint retrospectives to ask much better questions:
By framing KPIs as a tool for collective problem-solving, you build a culture where everyone feels ownership over improving the process. And once you've got the basics down, you can even explore more advanced approaches like reframing KPIs with AI for dynamic insights to uncover even deeper patterns in your data.
Measuring your team’s performance can be a game-changer, but it’s a double-edged sword. If you get it wrong, you can accidentally create the very problems you’re trying to solve. Done poorly, metrics breed mistrust and shift everyone’s focus to the wrong things. The goal isn't just to make charts; it's to build a culture of genuine, sustainable improvement.
Too many teams fall into the trap of measuring what’s easy, not what’s important. They end up with data that feels productive but offers zero real insight. Let's look at the most common blunders I've seen and, more importantly, how to steer clear of them.
This is the classic mistake. Vanity metrics are numbers that are easy to track and look impressive on a dashboard, but they have absolutely no connection to delivering actual value. Think lines of code (LOC), number of commits, or even story points completed.
Take lines of code, for instance. Rewarding a high LOC count actively encourages developers to write bloated, complicated code instead of clean, efficient solutions. A brilliant developer might solve a tough problem in 10 elegant lines, while someone else might churn out 100 lines of convoluted logic to do the same thing. On a LOC-based report, the less efficient developer looks more "productive." It's a system that punishes good engineering.
How to Avoid It:
Forget about raw output and concentrate on flow metrics instead. These tell you how smoothly value moves through your system.
These metrics paint a picture of the whole system's health, not just how busy individuals appear to be.
Nothing will sink your KPI program faster than using the data to point fingers. The moment metrics become a tool to rank or compare individual developers, you’ve created a culture of fear. People will immediately start gaming the system to make their numbers look good, even if it hurts the team, the codebase, or the final product.
When metrics become a tool for finger-pointing, they stop being a tool for improvement. The focus shifts from "How can we get better together?" to "How can I protect myself?"
How to Avoid It:
Keep all measurements at the team level, full stop. Treat the data as a conversation starter for retrospectives, not a report card. Your job is to ask "why," not "who." Instead of demanding to know who introduced a bug, ask, "What part of our process allowed this bug to slip through, and how can we strengthen it?"
Another common pitfall is getting tunnel vision on a single KPI. Let's say you decide to go all-in on increasing deployment frequency. You might succeed, but you'll likely find that quality plummets as the team rushes code out the door just to hit the target.
This creates a dangerous imbalance. High-performing engineering is a balancing act between speed, quality, and stability. Pushing hard on one lever without paying attention to the others is how you end up building a product that’s fast but fragile.
How to Avoid It:
Use a balanced dashboard that pulls in KPIs from different categories. A great starting point is the set of DORA metrics. By tracking speed metrics (Deployment Frequency, Lead Time for Changes) right alongside stability metrics (Change Failure Rate, Time to Restore Service), you get a much more holistic view. This ensures that an improvement in one area doesn’t create a massive problem somewhere else.
Diving into Key Performance Indicators (KPIs) can feel a bit overwhelming at first. It's totally normal to wonder where to even start or how to measure something as complex as productivity without accidentally creating bad incentives.
Think of this section as your personal FAQ—a quick guide to clear up the most common questions and get you moving in the right direction with a solid measurement strategy.
If you're new to this, resist the urge to track everything. The absolute best place to begin is with the four DORA metrics. They've become the industry gold standard because they give you a fantastic, balanced look at both your team's speed and the stability of your systems.
Start by focusing on just these four:
Once your team gets the hang of tracking and talking about these, you can start layering in other powerful metrics, like Cycle Time, to get a more detailed picture of your internal workflow.
This is a big one. The most important thing is to move away from measuring individual output and focus on the flow of the entire team. Old-school metrics like lines of code or the number of commits are not just useless—they're often harmful because they encourage the wrong kind of work. They don't tell you a thing about the actual value being delivered.
The right way to think about productivity is to measure the efficiency of the whole system, not the busyness of its individual parts. This builds a culture where everyone owns the outcome and works together to improve it.
Instead, lean on metrics that reveal how well the team delivers value as a unit. Cycle Time is the top contender here, as it tracks the complete journey from the first commit to a feature being in the hands of users. A high Deployment Frequency and the team’s track record of hitting their sprint goals are also excellent signs of a healthy, productive engine.
There’s no one-size-fits-all answer here. Different metrics tell different stories and need to be checked on different timelines.
Metrics that reflect immediate operational health—like MTTR or the number of critical bugs—should be on a dashboard that you glance at daily or weekly. This helps you spot fires and put them out fast.
Process-oriented metrics like Cycle Time and Deployment Frequency are perfect for discussing in your team retrospectives, maybe every two weeks. This is where you can spot trends and figure out how to smooth out the bumps in your process.
Finally, the big-picture business impact KPIs should be on the agenda for monthly or quarterly reviews with stakeholders. This ensures that all the great work your engineering team is doing is still perfectly aligned with what the business needs to achieve.
Marrying agile methods with outsourcing is more than just a popular tactic these days—it's a powerful strategy I've seen countless companies use to build better software, and build it faster. When you practice agile software development outsourcing, you gain the ability to respond to market shifts on the fly while tapping into a worldwide reservoir […]

At its core, the choice between Docker Compose and Kubernetes comes down to one thing: environment. Are you building and testing on a single machine, or are you running a complex application for real users across a fleet of servers? Docker Compose is your go-to for defining and running applications with multiple containers on a […]

Hiring an Angular developer isn't just about filling a technical gap on your team; it's a major business decision. You're bringing on an expert to build the very foundation of your application—one that needs to be scalable, maintainable, and fast enough to keep users happy. This is true whether you're a startup building your first […]


